| You Should Read the Tutorial First These pages will make more sense to you if you read the job submission tutorial first. It tells you how to:
You only need to read the sections that are relevant to you – don't bother with the parallel job submission stuff if you're not going to run parallel jobs. |
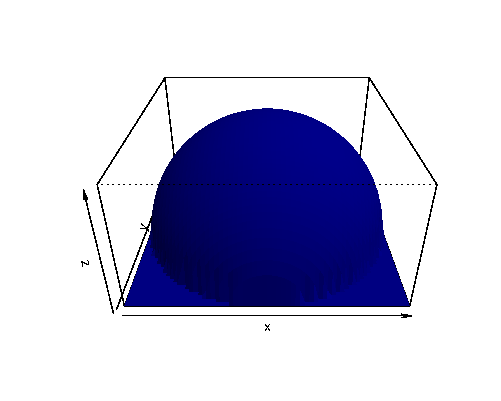
Running R on HPC's cluster nodes is similar to running any other serial job. In order to run R on the cluster nodes, we will need an R script and a QSub script. Here is a sample script that makes a 3D plot of a hemisphere. We will put it in hemisphere.R:
positive_integer_radius=30
n=positive_integer_radius*2+1
index=matrix((0:(n*n-1))%%n-positive_integer_radius,nrow=n)
x=0:(n-1)-positive_integer_radius
y=x
z=sqrt(positive_integer_radius*positive_integer_radius-index^2-t(index)^2)
z[is.na(z)]=0
postscript("perspective.eps", horizontal=FALSE, height=4, width=5, pointsize=10)
persp(x,y,z,phi=30,theta=0,lphi=60,ltheta=70,border=NA,col="dark blue",shade=1,scale=FALSE)
dev.off()
postscript("contour.eps", horizontal=FALSE, height=4, width=5, pointsize=10)
contour(x,y,z)
dev.off()
In order to run this script on the cluster nodes, we will need a qsub script which I will call hemisphere.qsub:
#!/bin/bash
: The above line tells Linux to use the shell /bin/bash to execute
: this script.  That must be the first line in the script.

: You must have no lines beginning with # before these
: PBS lines other than the /bin/bash line:
#PBS -N 'hemisphere'
#PBS -o 'qsub.out'
#PBS -e 'qsub.err'
#PBS -W umask=007
#PBS -q low_priority
#PBS -l nodes=1:ppn=4
#PBS -m bea

: Change our current working directory to the directory from which you ran qsub:
cd $PBS_O_WORKDIR

: Tell R to execute our plotgrades.sas script and then exit:
R --no-save < hemisphere.R
To run that script, you must submit it to the scheduler as a job using the qsub command:
qsub hemisphere.R
That will print out something like:
8031.hpc.cl.rs.umbc.edu
Eventually your job will run – you can run qstat to determine if your job is queued, running or completed. See Monitoring and Controlling Jobs on HPC for more information on how to do that. Once your job completes, it should produce several files. If you list them using ls -l, you should see something like this:
-rw-rw---- 1 straha1 pi_sparling  40758 Dec 17 18:37 contour.eps
-rw-rw---- 1 straha1 pi_sparling    529 Dec 17 18:37 hemisphere.R
-rw-rw---- 1 straha1 pi_sparling    559 Dec 17 18:40 hemisphere.qsub
-rw-rw---- 1 straha1 pi_sparling 291359 Dec 17 18:37 perspective.eps
-rw-rw---- 1 straha1 pi_sparling     98 Dec 17 18:41 qsub.err
-rw-rw---- 1 straha1 pi_sparling   1330 Dec 17 18:41 qsub.out
The qsub.err and qsub.out files contain everything that your job printed to its error and output streams, respectively. The two .eps files are the plots that your program generated. If you open the files in a .eps viewer, they should look like this:

except that they are EPS files rather than GIFs. You can download sample output files using these links: